Dot Plots
- XLogo
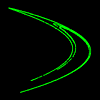
These images are generated by plotting a (usually large) number of discreet dots. No lines are drawn between dots. Some of the images are created from mathematical equations, and can take a while to complete. If a mapping function is used then they are called 'Iterative Function Systems' (IFS). In XLogo, the dot command plots a single pixel in the pen color at the specified XY co-ordinates. The turtle does not move to the new position to draw the dot. See also:
|
|
- Animation
- Art
- Cellular Auto
- Coding
- Demo
- Dot Plot
- Fractal
- Grid
- Illusion
- L-System
- Multi Turtle
- One Line
- Perspective
- Plane Filling
- Polar
- Puzzle
- Recursion
- Sound
- Spiral
- Spirograph
- Trees
- Walks
![]()

